| Administrating the Server resources such as memory, processes and storage and low level resources such as locks, latches and queues are crucial as these are consumed by transactions. This post outlines some tips on managing server level and database level resources and also explains monitoring user sessions and their activity as well as concurrency structures such latches and locks. |  |
Managing Memory
In SQL Server memory is managed at server level, basically operating system level making sure that each operation gets enough memory.You can also configure to manage the memory at instance level. SQL Server performance can be viewed through dynamic management objects , memory related counters using performance monitor and SQL Profiler. The number of configuration options such as Minimum Server memory and Maximum server memory can be used to set limits on how much memory that SQL Server can acquire. The three performance monitor counters that you can use for memory are Buffer Manager, Cache Manager and Memory Manager.
Managing Processes
In SQL Server background processes are not configurable and exception is check point process which can be configured through recovery interval setting. You can configure how many Maximum threads that SQL Server can use under maximum load or you can leave this setting to default.
Using the Performance Monitor
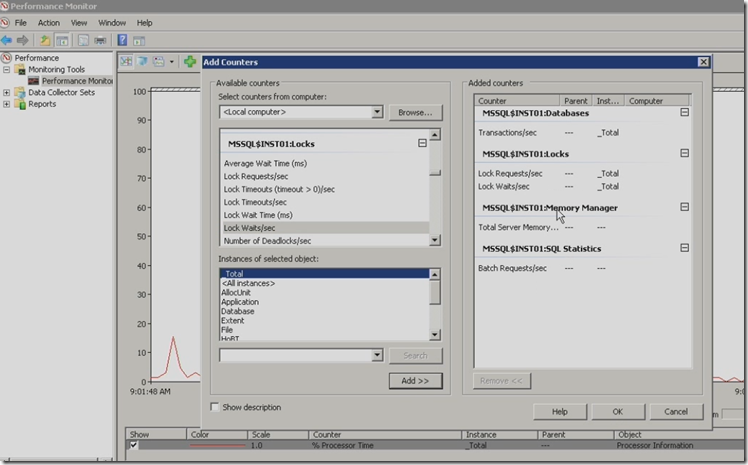
Start the performance monitor by typing perfmon in run command and add some SQL Server counters
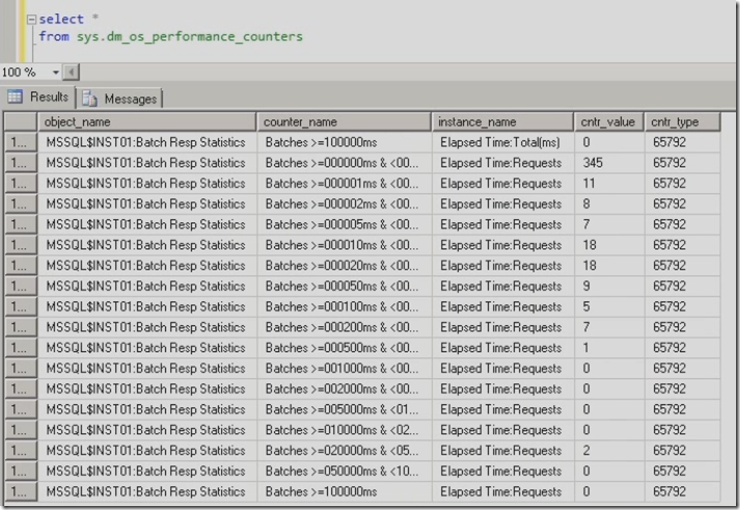
Note each SQL Server instance that running has it’s own set of counters. Choose the one which you want to monitor. In this example we are selecting some memory related counters under memory manager category. Run some SQL queries and you can monitor the performance on monitor tool. The above is just an example and you can use various SQL Server performance counters to monitor the performance, the DMV to find out the number of counters is sys.dm_os_performance_counters.
Managing Storage
Typical tasks in managing database files include
-
Expanding the data or transaction log space
-
Shrinking the data or transaction log space
-
Adding or Removing data and transaction log files
By default SQL Server manages these log files and default setting is auto grow. It is important to take the backup of transaction logs and shrink them frequently. Creating the database files and transactions files with predefined amount space is good practice. In SQL Server you can add additional files for additional growth.
Managing Sessions and Transactions
In SQL Server , Views, Stored Procedures and Utilities can be used to relate sessions , transactions and resources. The tools like Activity monitor and SQL Profiler which are shift with SQL Server can be used to perform the basic activity monitoring. For example SQL Server profile can capture all the queries or batches that are executing on your server and you can also use filters to narrow down the results.
Managing Concurrency Structures
Locks and Latches comes under this category. The difference between Lock and Latch is that locks are transactional and they are used to manage the consistency of your data within the scope of your transaction. Latches are more physical and they are only used to protect the integrity of physical structures such as database. Locks are used to prevent logical consistency where Latches are used to protect physical consistency of your data. Because of these Locks and Latches you may be run into concurrency problems.
Blocked process report , if you configure a blocked process threshold on your instance of your SQL Server then it generates a special blocked process report every time a process waits for to acquire a lock for the given configured amount of time. Blocked Process report is a piece of xml which describes which process was blocked and also gives the info on resource. Another important aspect of locking is possibility of encountering deadlock.Deadlock situation can not resolved itself off course it requires intervention. SQL Server has a component deadlock monitor which has the responsibility of detecting and resolving the deadlocks.
Capturing the Deadlock information
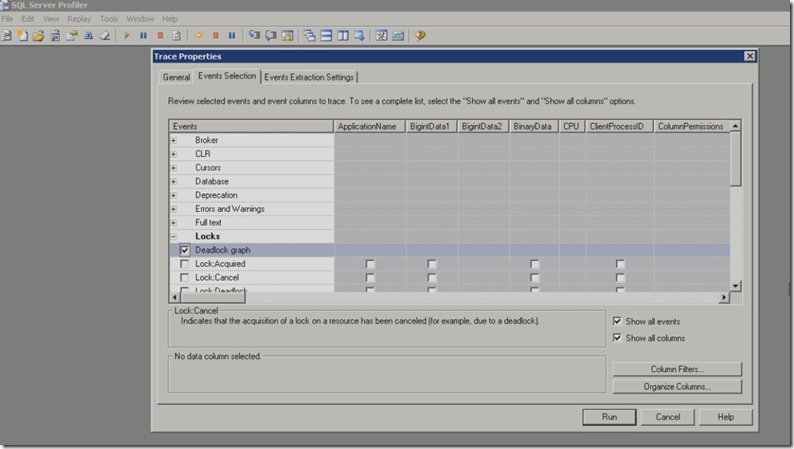
Open the SQL Server profiler and start a new trace and you are interested in one event Deadlock graph select as shown below and click run
As a developer you may be interested in knowing the deadlock background information which you can get this from Deadlock graph
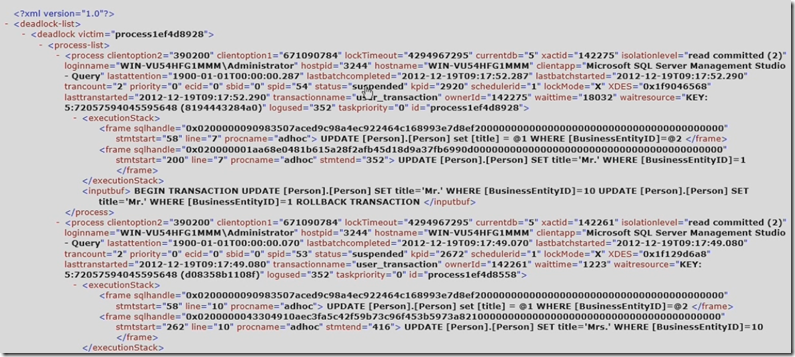
The graph shows you the processes and resources involved in the deadlock. You can see the xml of this graph in textdata column. You can export this information to a file have the extension xdl. It becomes easy to monitor, explore and capture the deadlock information using this graph. The xml of the deadlock graph provides a very detailed information on processes involved the deadlock and it looks as below
| Share this post : |  |
 |
 |
 |
 |


