Report builder 2.0 is a report authoring tool that we can use to design and publish reports. We can specify the data source, what data to display on report and which layout you prefer to see the report. When you run the report, the report processor takes all the information you specified and retrieves the data and generates each page as you view it. This post explains step-by-step details of creating the report using Report Builder 2.0.
Using Report Builder you can
- Create reports with tables,charts and matrices.
- Modify the report data by filtering, grouping and sorting data. You can also add formulas and expressions to reports data.
- The look and feel of the designer is much similar to Office 2007.
- Supports running reports locally or on server.
- Report model is not required for creating the queries. You can write the queries in query designer or import queries from the existing reports.
- You can export the report to file type TIFF, PDF, Excel, Word, or HTML.
Download Report Builder 2.0 here. Report Builder was first introduced in SQL server 2005 and it is still available in report.
After Installing Report Builder you can launch it by Start->All Programs->Microsoft SQL Server Report Builder 2.0.
1. After launching the Report Builder 2.0, you will see the following screen
2. Visually there are number of differences when you compare with the SQL Server 2005 report builder.
- The office 2007 ribbon interface.
- On the left hand side of the designer you will see built-in fields,report parameters, images and data fields.
- To begin designing a report, you can select either Table or Matrix or Chart icons from designer interface as shown above.
3. This post using the AdventureWorksDW2008 sample database as data source. You can download the databases from here.
4. Select the data source for you report as follows
5. After completing the data source connection configuration above then click next to design a query for your report.
Either you can select the data fields or views from your database or you can use editor to type your sql query for binding data.
6. Click next to get the Arrange fields-dialogue box where you can drag and drop your data fields into the Row groups.
7. Click next to choose the layout for your report
8. You can also the chart in your report with the same data source which we defined above as follows
9. Run the above report then you will see the following output
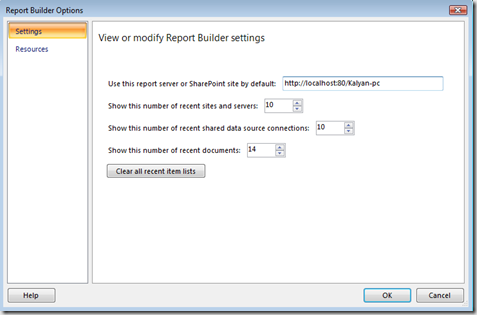
10. You can deploy the above designed report to a SQL server 2008 Report Server. You should specify the URL of the default report server in Report Builder Settings. Click the database icon in top-left corner from Report-Builder window and you will see the following dialogue
You can enter the URL of your default report server or SharePoint site where you want to deploy your reports.
| Share this post : |


