IntelliTrace UI has completely redesigned in Visual Studio 2015. This post outlines what improvements have been made to IntelliTrace and PerfTips which is a feature to evaluate your application performance easily during the debugging process. These features are available in VS 2015 CTP5.
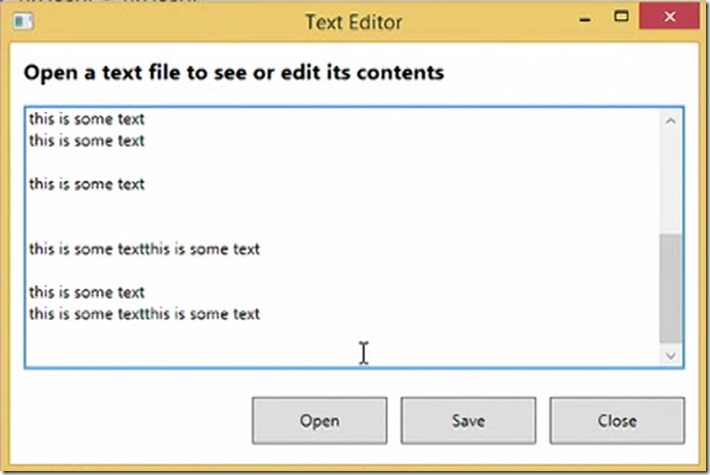
Using the new features in IntelliTrace, it is really easy to fix the bugs. Let’s take a scenario, Assume you have simple text editor which allows you to open a file and save the changes back to the file.
In this sample, if you go to the bottom of the file and update some content and click save then it moves the cursor back to top instead keeping the cursor where it was before
To fix the bug, the first place you would like to see for cause of this error is event handler of save button, but it may not be right place to look. The bug can be hiding somewhere else as well…
Now run the application in debug mode and hit break all button which makes every thread to hit break point
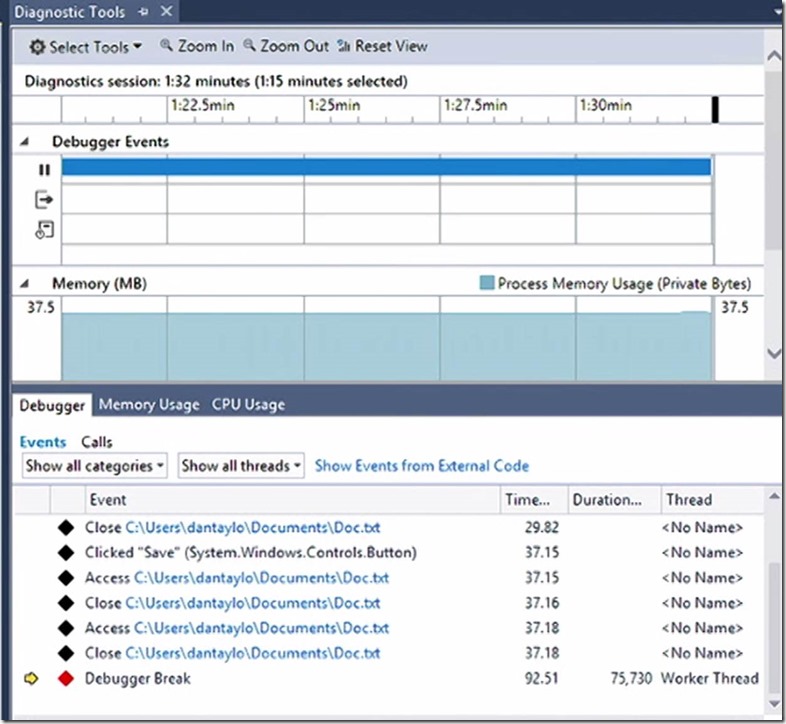
It shows the list of events that IntelliTrace has collected as displayed in above picture, even if you do not have any idea about the code but by looking at the list of events, you can tell the problem is at second access and second close event. It is telling you to this is the place to look to fix the bug.
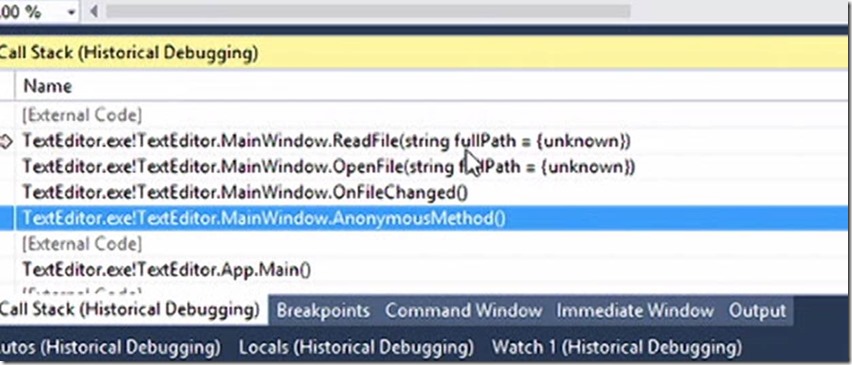
When you click the event and then click the activate historical debugging link then it takes you to the code that is responsible for generating this event then you look at the code for fixing the bug
It is way faster compare to putting breakpoints and debugging to find the place for cause of the error. It also shows all call stack as shown in the following picture
The new in visual studio 2015 is you are getting the events in tabular format with additional columns named Time, Duration and Thread
On top of the tabular window, it is showing the same set of events and same data represented in time line format. It is basically splitting up the events in to three trucks; first truck gives you all break events
The second truck is output events truck, anything goes to output window IntelliTrace collects and push it to the time line then you can see how these are related to other things in your application. Finally you have IntelliTrace events truck that where every other event get collected. The nice thing about timeline is it gives you eagle eye view about your application how it is doing and when select the time selection it then filters events accordingly in table.
PerfTips, assume you are having long running application which is actually taking time to load the images. The first thing you do is put a break point and debug the code, while you are doing the debugging PerfTips shows the time in milliseconds that each line took to run
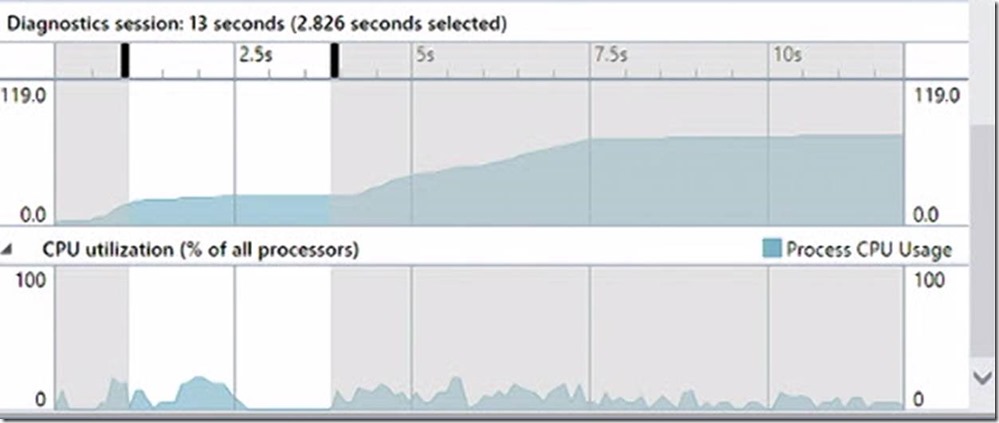
When you click the PerfTips link, in this case <3ms link it brings diagnosis window, which actually shows the time line shows each step with amount time it took to run , it is basically a visual history
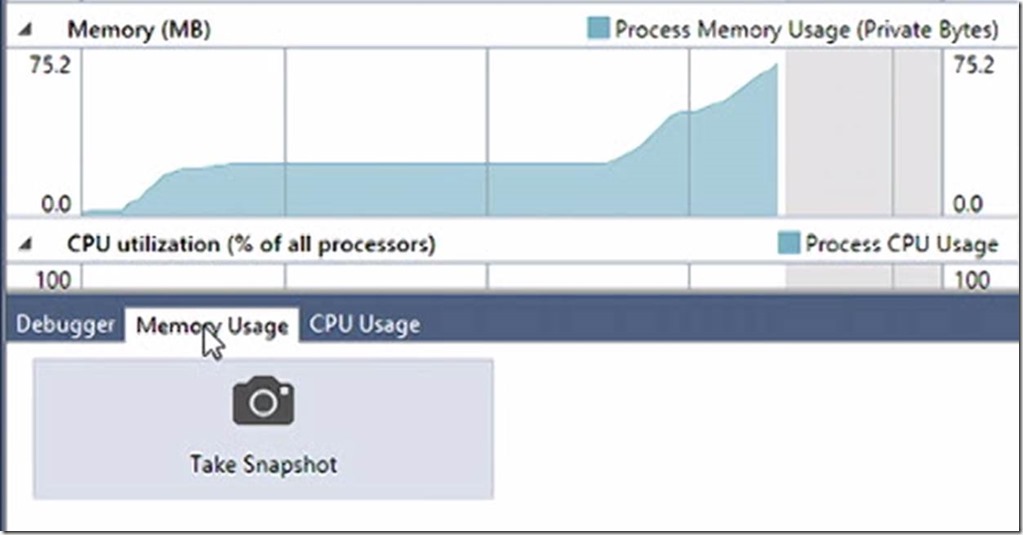
You can see CPU and Memory characteristics of each step when you click the step
Memory usage tool is snapshot, moment and time based. You need to decide at what point of time your application is taking more memory and snapshot will allows you to take all the types that relay on the heap. Take Snapshot while you are debugging and analyze the objects in heap.
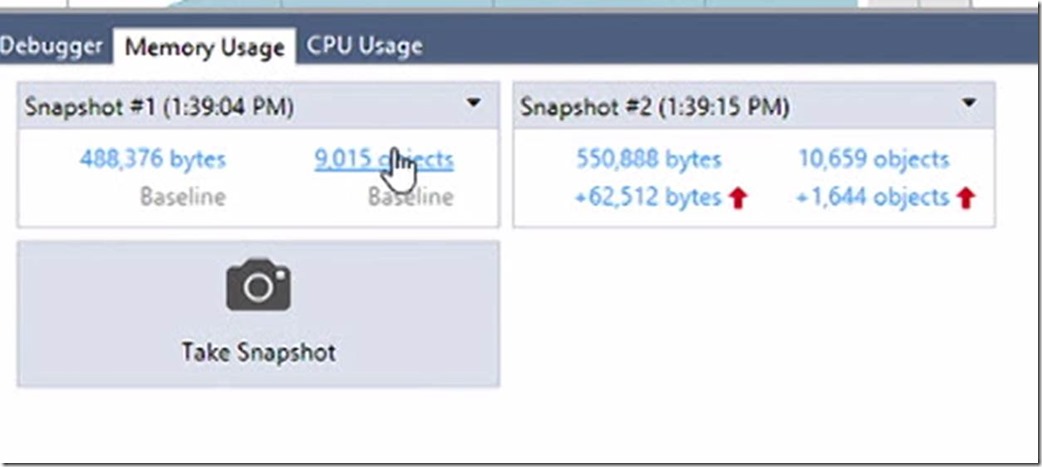
It gives you the high level overview of what it collected and difference in no of collected objects as shown in following picture
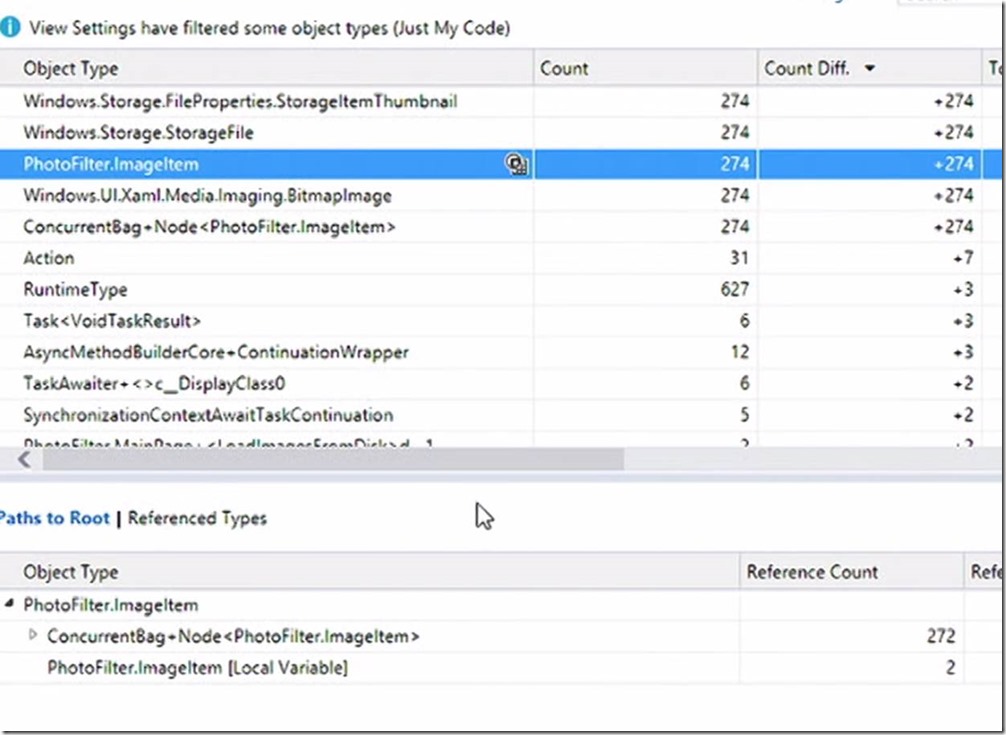
If you click the links then it will takes you to the heap view where will see all of the type that relied on heap
