The typical web page in the application includes references to JavaScript and CSS files and images. It is hard to debug the page without a tool to find a certain piece of HTML where it is coming from. The Page Inspector is a debugging tool that runs inside Visual Studio and it comes with the Visual Studio. This post explains the Page Inspector features and outlines how to use it inside Visual Studio editor.
Launching Page Inspector
Launching Page Inspector is pretty simple, in order to launch Page Inspector your site needs to be run in debug mode or you need add a key to Web.config. If the debugging is not enabled on your site then add the following key to your web.config as shown below
<appSettings>
<add key="PageInspector:ServerCodeMappingSupport" value="Enabled>
</appSettings>
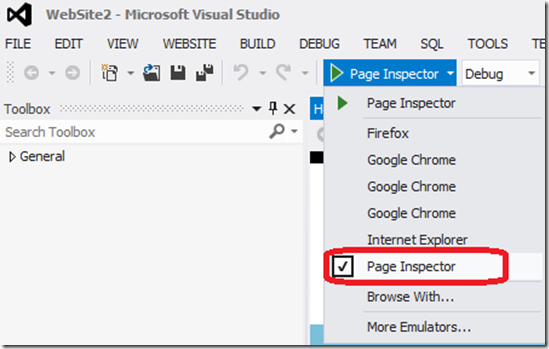
Choose the Page Inspector from Target Browser drop-down on the Standard tool bar as shown below
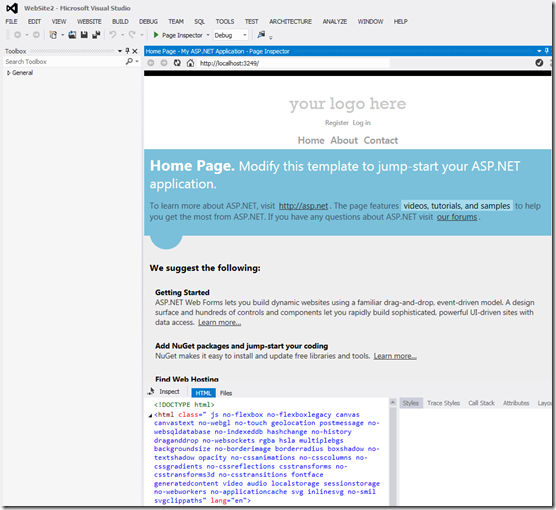
Now click F5 then Page Inspector is loaded in the document window inside Visual Studio as shown below
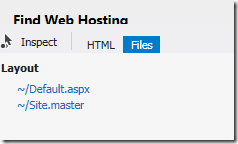
In the bottom the screen you see two tabs and a button, Inspect button which allows you to point at elements in your page. Files tab shows all server side files that are used to render this page. HTML tab just shows you the html for the page.
when you click the files in files tab it then opens them side by side with the Page Inspector. Now click the Inspect button and then hover the mouse over different elements in your page, When you perform this action, the code file that generated the element is shown with the Page Inspector as shown below
If you change the source file when Page Inspector is open then a yellow bar will appear asking you to refresh the browser to see the changes , press CTRL + ALT + ENTER to refresh the browser.
If you change anything in HTML tab in the lower left corner of the Page Inspector the changes not persisted in your source. You still have refresh the browser to see the changes.
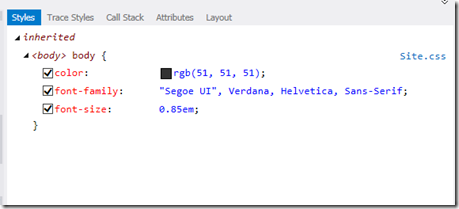
The lower right of the screen shows you the CSS styles and the file name in the styles. Click the file name in this case Site.css to make any changes to the styles and refresh the browser you will the changes automatically.
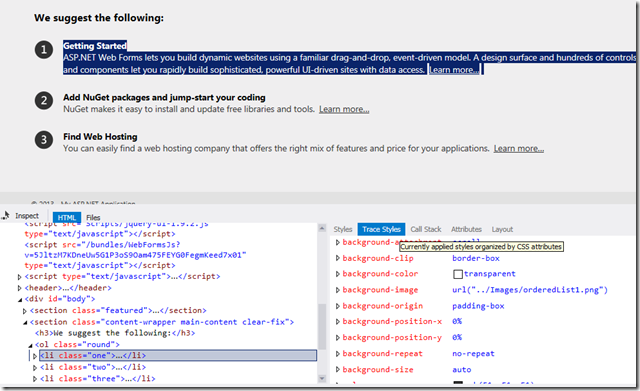
Click the Inspect button and high-light the text in your site then switch to the trace styles tab as shown below
Trace styles shows you the all CSS styles that are currently in effect for the selected element. This allows the developer to easily trace out the styles where it is coming from. If you make any changes to the Trace Style those would not persist to the source files until you save them in source files. The other two tabs Attributes and Layout allow you to add additional attributes and to visualises the box model. Press Shift + F5 to stop using the Page Inspector.
Page Inspector is a good diagnostic tool which is useful in debugging your code during the development of your site.


Keep posting like this
Thanks